In what directions NIFTY will go ? Is NIFTY strong or weak ? See full analysis below with different time frames
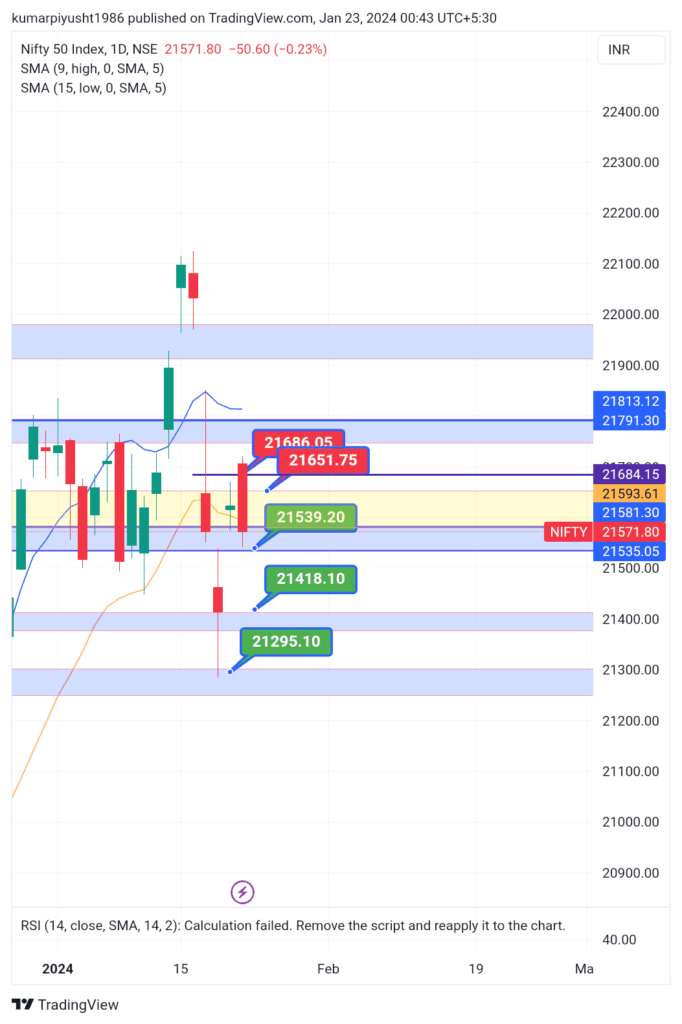
1 DAY TIMEFRAME

NIFTY DAILY CHART
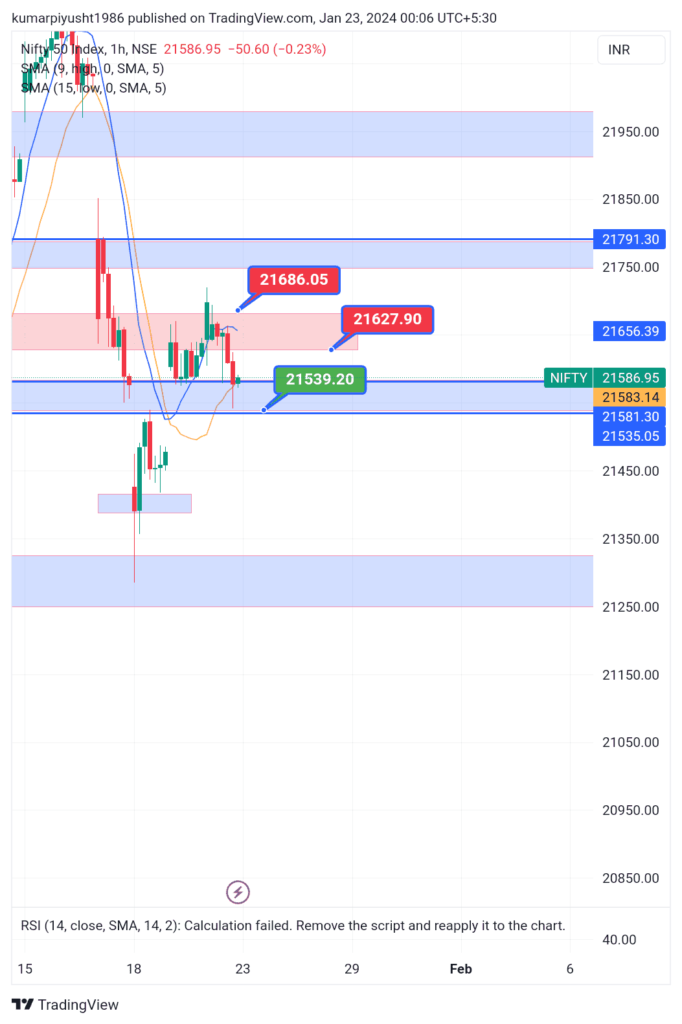
1 HOUR TIMEFRAME

NIFTY 1 HOUR CHART
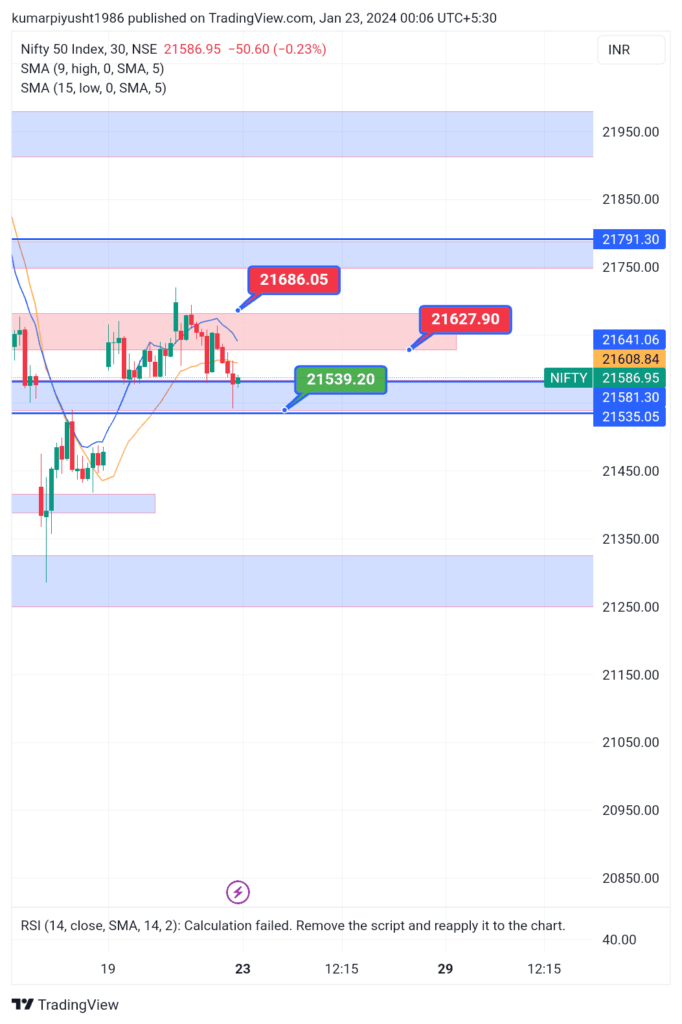
30 MINUTES TIMEFRAME

NIFTY 30 MINUTES CHART
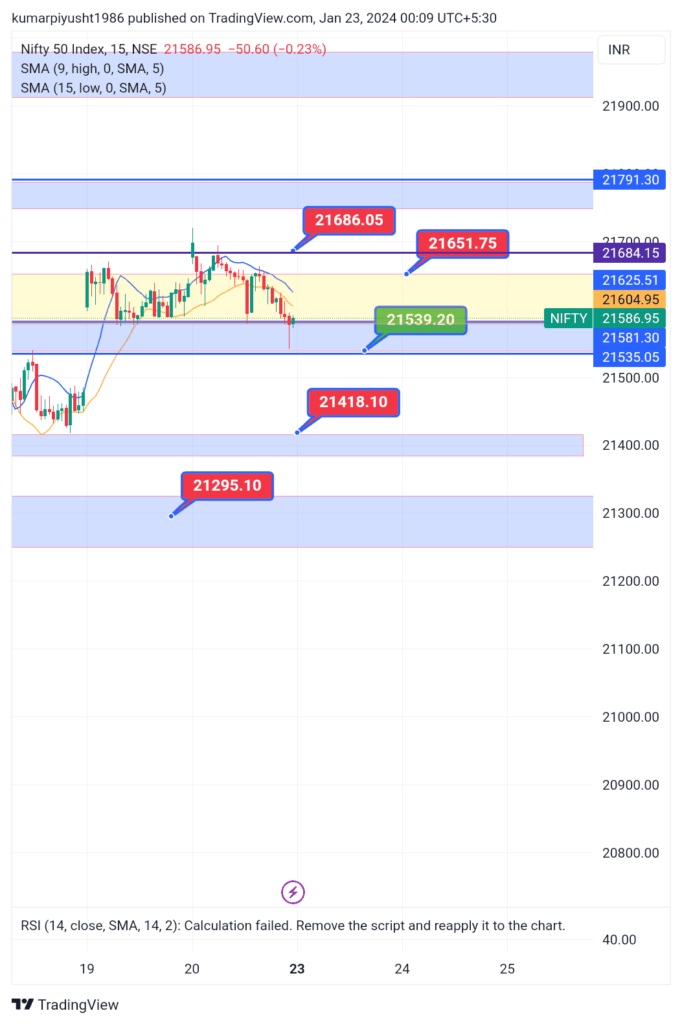
15 MINUTES TIMEFRAME

NIFTY 15 MINUTE CHART
ANALYSIS :
If we go through the different time frames we can easily see that ,NIFTY is weak below the level of 21540 on INDEX chart.if nifty will go below 21540 level there is strong sign of market weaknesses,and there is strong chances that nifty will faal for approximately 100 to 130 points from there.
If market suppose to be bullish there would be a gap up opening above 21700 that will be sign for bullish momentum and we can easily see the 21800 level tomorrow.
For upside important levels are ⏬
RESISTANCE LEVELS
Resistance 1 WILL BE– 21651
Resistance 2– 21686
For downside important levels are ⏬
SUPPORT LEVELS
Support 1- 21540
Support 2–21418
Support 3 –21295
NOTE –THIS IS JUST AN ANALYSIS AND DOESN’T GIVE ANY 100% ASSURITY OF MARKET MOVEMENT ,THIS IS JUST FOR EDUCATIONAL PURPOSE. PLEASE TAKE ADVISE FROM YOUR FINANCIAL ADVISERS BEFORE MAKING ANY INVESTMENTS.
FOR MORE SUCH STOCK MARKET NEWS UPDATES
FOR MORE ENTERTAINMENT NEWS CLICK HERE
MORE MARKET NEWS CLICK HERE
